Make a predictive lead prospecting (Predictable lead prospecting), is a very important task for monitoring current trends and for decision making in your company, learn how to use this information and meet your objectives.
At first glance it may seem a long and complex process, but when making important decisions related to the fulfilment of our main objective, we should not overlook certain aspects that could be useful to us. A very effective and simple way to avoid possible errors is the analysis of lead prospecting.
INDEX
- What is the main objective of Predictable lead prospecting?
- Key indicators and questions.
- Dimensions and classifications.
- Examples of a case study.
- Predictable lead prospecting analysis.
- Conclusions.
1. What is the main objective of Predictable lead prospecting?
One of our main problems and which we want to solve through a comprehensive prospecting analysis is the following: being a B2B marketing agency we want to find out if we are able to deliver within x days a significant number of leads to our customer.
Meanwhile it is dedicated to analyze millions of pages of online stores and marketplace through artificial intelligence monitoring prices, analyzing competition. So while we as an agency can identify types of deals (objective profiles), which depend on the projection (international or national) and the type of company (brand or retailer).
2. Key indicators and questions
The people involved in this case will be: an SDR, SDR Manager, Copywriter and a commercial director, for each position we build a different dashboard using various dimensions, metrics and KPIs.
To define them we have asked ourselves a series of questions, which will help us to know what data we must extract to achieve our goal from dashboards.
For example, to find the SDR indicators we have defined:
- Am I more likely to schedule a brand or retailer meeting?
- Am I more likely to schedule an international or national meeting?
- Why do I lose brand/retailer operations?
- Why do I lose international/domestic operations?
- Where do the best deals work for me?
For other positions they would be very different, since the tasks and progress to be measured vary according to the type of work and its place in the prospecting chain.

3. Dimensions and classifications
It is important to define what our capacity is, so for this we look for what is the relevant information that will help us answer the questions asked above. This information will be displayed in graphics to make it more visual and easy to understand our ability, but taking into account classifying them into important categories of campaign such as:
- Company type
- Projection
- Won/Lost
- Provenance
4. Examples of a case study
Below, we will expose the extracted data in a clear example of the analysis in the form of a graph, how the visual development that we are going to expose to the customer looks:
- Type of enterprise
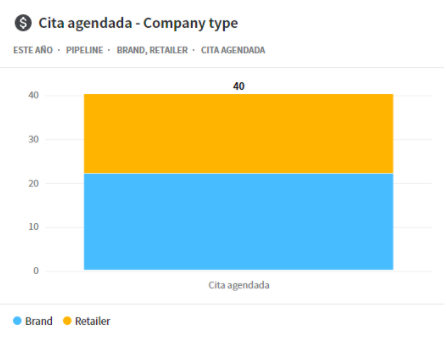
This is the graph that answers the question: Am I more likely to schedule a brand or retailer meeting?
To make the chart we have decided to filter by the number of deals we have at the stage “Appointment scheduled” and if these deals belong to the brand or retailer sector.
As you can see from the chart, I’m more likely to schedule a brand meeting.
- Projection
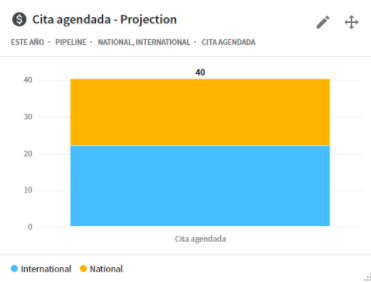
This is the graph that answers the question: Am I more likely to schedule a national or international meeting?
To make the graph we have decided to filter by the number of deals we have at the stage “Appointment scheduled” and if these deals are national or international.
As you can see from the chart, I’m more likely to schedule an international meeting.
- Lost/Won
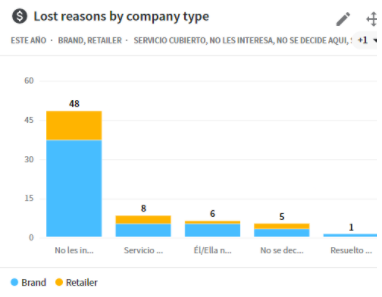
The reasons for loss are as follows:
- Don’t care
- Others
- Covered service
- It’s not decided here, it’s decided centrally
- He/She is not in charge
- Internally resolved
This is the graph that answers the question of: Why do I lose brand/retailer operations?
To make it we have decided to filter by the number of lost deals we have in each stage, if these are brand or retailer and for the reason of lost.
As you can see from the chart, the main reason for losing is “They don’t care”. We mark this reason when the deal does not show any interest in the product of our customer, usually when they give answers of this type is because they have not read the mail or do not know very well what this is and what can bring them.
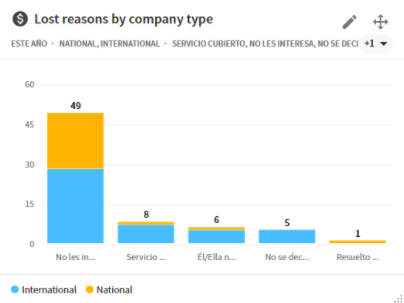
This is the graph that answers the question of: Why do I lose international/domestic operations?
To make the graph we have decided to filter by the number of lost deals we have at each stage, whether these are national or international and for the reason of lost.
As you can see from the chart, the biggest reason for loss is “Don’t care” followed by covered service.
The dashboard gives us a list of the lost deals with the reasons “They are not interested”, from this we can better analyze the emails and for example send them another proposal that is more appropriate to your product or service.
We will talk more about the subsequent actions derived from the in-depth knowledge of these reasons in other articles dedicated to Predictable Prospecting.
- Provenance
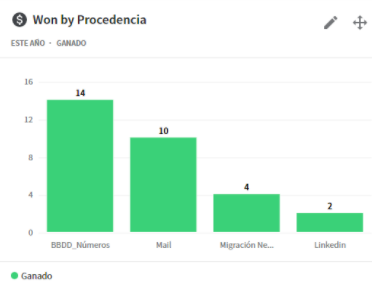
This is the graph that answers the question of: Where do the deals that work best for me come from?
To make the graph we have decided to filter by the number of won deals we have and their origin.
There are 2 types of origin:
- By the nature of the data (Migration* of other customers’ contacts or own BDDs)
- By the channel through which we are impacting (LinkedIn and mail)
Knowing how to identify the channel is more important than we think, we must know which of these works best for us to invest more time and money in this. For example, as you can see in the graph above the channel that works best for us is mail, since we have won more deals through this channel.
The origin of LinkedIn works the least for us, so we must invest more time and resources in mail and consider the use of LinkedIn as an additional channel, trying to automate most of the management of that.
As you can see in the graph, the biggest reason for earned is the provenance by “BBDD Numbers”, in it appear phone numbers linked to the accounts of people included in that database and other data such as name, email, company.
These are the prospects that have run in campaign and have received the entire sequence of mail but have not answered, these are loaded to the CRM and there we give them the follow-up, these belong to mail, because that is the channel through which they are impacted.
5. Predictable lead prospecting analysis
After carrying out our research, if we look at the charts above, and with the help of other data such as the volume of companies we have in the databases we can finally say whether or not we are able to meet our goal.
Reviewing which sectors to bet on and with which we have the best results will give us an idea of where to lean more efforts and which ones to leave as means of reinforcement, this will help us to meet specific monthly targets on which we can effectively meet.
6. Conclusions
- The external impact
The graphical data compared and synthesized give us knowledge and allow us to correct the strategy and even the product if we see that the UVP and USP does not fit in the desired market.
It is very important to know our target to know with certainty to which people we should sell our service/product and how to do it to impact more.
Another important factor is knowing how to interpret the data, since as we have seen in the graphs of examples, they provide us with relevant information for our business, but without the appropriate analysis they do not facilitate the making of profitable and effective decisions.
For example, in the case in focus, there are several possible avenues for further action:
- Conduct a new market study, which interests the customer but does not generate many opportunities (retailers nationwide) to discover their needs and adapt the product.
- Deepen the surveys of prospects not interested in the product to better know their motives and change consecutively.
- According to the indicators achieved recalculate the price of the solution in relation to the objective annual turnover.
- Expand the vision to niches and markets with greater potential and/or lower cost of customer acquisition.
- The internal impact
On the other hand, if we know how to squeeze the numbers and get to the bottom, we can not only correctly target the product or marketing strategies but we will manage to analyze and improve the business itself.
There are more or less efficient equipment and/or tools, only by looking at the performance in perspective can we make informed decisions about development, growth and investments, whether in the form of time or money.
For example, we saw above that with good BBDD and qualified SDRs we deliver more leads than we do with LinkedIn prospects. Great, we need to strengthen the SDR and Lead Prospecting team with human capital and automate LinkedIn management with tools to not focus on something secondary that is not even profitable.
Also dependent on the causes of loss of opportunity it is possible that some minor corrections in the BANT speech may decrease the leakage of prospects at the interaction stage.
By analyzing consecutively the metrics and indicators established for other involved positions we can perfect the process, the final goal may be to find a point where the cost of acquisition or the speed of maturation of a lead are the least possible.


