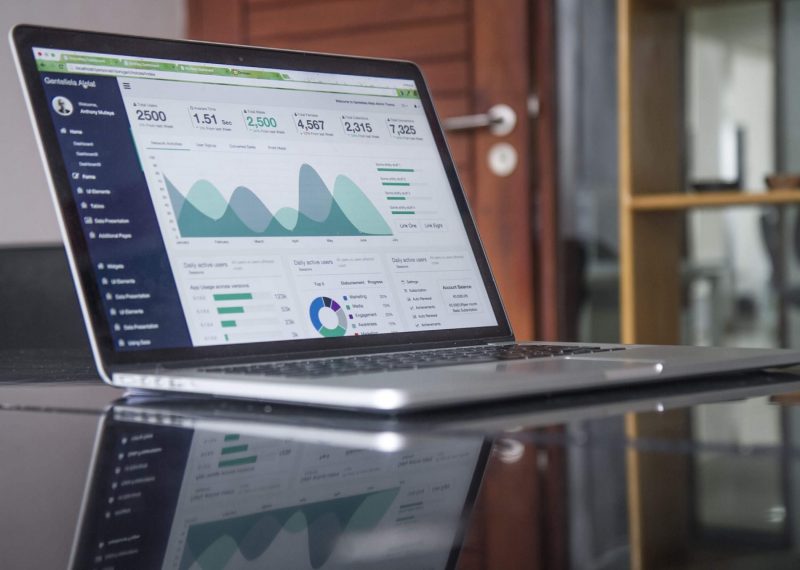
First, let’s start with the basics. The simplest way to think of a dashboard is as a visual representation of data.
Raw data can be hard to look at. While the digits are there they are usually impossible to process and understand. So you will need to turn data into information (yes, those are two different things!) by creating different charts, tables, and other visual elements that are far easier to comprehend and utilize.
Needless to say, dashboards have a wide array of uses—from budgeting or project management to marketing or sales reporting.
For example, if you have a banking application you surely have seen a tab that divides all your monthly expenses into different categories and shows them in a form of a colourful pie chart, right? So, this is one of the possible examples of a dashboard. Add some goals, your family’s linked accounts and historical data to track your progress, improvements and unseen impulsive purchases and – congrats! – you’re fully into data visualization and ready to apply your new knowledge to your business. Why would you do that?
Purpose of a business intelligence dashboard
A business intelligence dashboard (BI dashboard) manages information by tracking data points that are important to your business. The dashboard gives you a consolidated view of all data from across the organization on custom dashboards that deliver valuable insights into the whole business. You can see and analyse data, display the businesses key performance indicators (KPIs), to assess performance measures and generate actionable insights.
A good BI dashboard enables you to monitor and measure business performance and metrics. BI dashboard tools provide real-time centralized access to users allowing them to interact with and evaluate information, helping them to make smarter, data-driven decisions.
What’s that you couldn’t have achieved without a dashboard?
Well, here’s one. Have you ever faced a situation when you simply couldn’t find the data because all the excels, documents, databases spread evenly over all the departments and your employees’ PCs? A dashboard can put all that data into the unique directory.
Among other benefits there are:
1. Enhanced visibility
BI dashboards provide greater visibility with information available whenever it is required to ensure businesses are better placed to respond to changing market conditions.
2. Timesaving efficiency
With BI dashboards, you are no longer wasting valuable time generating reports from multiple systems. Instead, data is drawn from a centralised source and displayed as an easy to interpret visual overview.
3. Better forecasting
With greater insight into the buying cycle of each customer, future demand can be more accurately predicted using historic information. Businesses can more effectively plan for demand fluctuations for the next business cycle, setting measurable goals and deliverables for greater success.
4. Key performance indicators
BI dashboards source data from multiple areas displaying the information as easy to understand visuals in real-time. This provides managers with an overview of current KPIs to assess different areas of performance while creating actionable insights.
5. Inventory control
With analytics and a real-time vision of inventory stock details, sales staff know what items are in stock and where they are located. BI dashboards improve inventory control using detailed historic data to optimize supply quantities and inventory allocation across stores and minimizing the risk of stockouts.
6. Real-time customer analytics
With real-time, accurate insight on current customers purchasing behaviours, you have a better chance of achieving higher retention rates and increased revenue. Real-time insight allows sales teams to concentrate on the right customers at the right time, ensuring marketing efforts and activities are focussed toward the right clients.
7. Better decision-making
Whether you’re providing reporting and analysis for the entire organization or functional areas of the business, a BI dashboard allows companies to analyse key data quickly and meticulously. Visualized interactivity serves to deliver overwhelming amounts of data in a way that is easy to understand. With the ability to easily identify what the data really means; better decisions can be made relevant to the business.
If you are ready to get to know the Business Intelligence world, don’t hesitate.
However, before doing so, it’s essential that you lay the appropriate groundwork first. Here are a few things you’ll want to do before getting started on a dashboard:
1. Import your data into Excel
In order to create a dashboard, your data first needs to exist in a spreadsheet.
There are numerous ways to do this with ranging complexities—depending on where your data exists currently. So, your best bet is to research how to import your specific data format.
2. Clean your data
When working with data within Excel, it’s important that each piece of information lives within its own cell.
If your existing spreadsheet is a bit of a patchwork mess, take some time to clean it up and organize into appropriate rows and columns. It’s also wise to get rid of glaring typos and possible errors.
Now is also an excellent time to search for any duplicate information and delete it once detected, because each row of data needs to be unique in order to avoid double counting.
Want a quick way to search for duplicates? Highlight your entire dataset and then click the “Remove Duplicates” button.
3. Set up your workbook
To create a dashboard, you’re going to need three separate sheets (or tabs) within your Excel workbook.
The first is to contain only the Raw Data to work with. The second is for the data used to create your charts. And the third is for the charts themselves.
4. Understand your requirements
Basically, clear out why you need the dashboard in the first place. What’s your goal with this work? Do you need to track progress? Analyse a budget? Identify trends?
We’ll talk more about that in the Part 2 of our article.


