Predictive prospecting* of leads is very important for monitoring current trends, data analysis and above all for decision making. It aims to provide information as quickly and clearly as possible, which will be used to achieve short or long-term objectives.
At first sight it may seem a long, complex and sometimes boring process, but when making important decisions related to the achievement of our main goal, we should not overlook certain aspects that could be useful to us. A very effective and simple way to avoid possible mistakes or oversights in this respect is the analysis of lead prospecting.
*Predictive prospecting consists of creating generated profiles of current clients/customers/partners (their interests, socio-demographic characteristics, etc) in order to look for new prospects who are more likely to buy in the future.
The case in focus
One of our main problems, which we want to solve by a complete prospection analysis: being a B2B marketing agency we want to find out whether or not we are capable of delivering 20 leads for a client in a 30 days period.
Our client is dedicated to analyse millions of pages of online shops and marketplaces by using artificial intelligence monitoring prices, analysing the competition.
It has 4 types of deals (target customer profiles) that depend on the projection (international or national) and the type of company (brand or retailer).
View
The persons involved in this case will be: an SDR, an SDR Manager, a Copywriter and a Sales Director. For each position we build a different dashboard using different dimensions, metrics and KPIs.
To define these dimensions and metrics, we have asked ourselves a series of questions, which will help us to know which dates we must extract to achieve our objective from the dashboards.
For example, the questions we have defined to find the SDR indicators are the following:
- Am I more likely to schedule a brand or retailer meeting?
- Am I more likely to schedule an international or national meeting?
- For what reasons do I lose brand/retailer operations?
- For what reasons do I lose international/national operations?
- Where do the deals that work best for me come from?
For other positions they would be very different, as the tasks and progress to be measured vary according to the type of work and its place in the prospecting process. In this article we will only look at the example of an SDR.
Dimensions
- Company type
- Projection
- Won/Lost
- Source
Once these dimensions and their variables have been defined, we move on to find out what relevant information will help us to answer the questions formulated above. This information will be displayed in graphics to make it more visual and easy to understand.
The study
We will now present the extracted data from the analysis in a graphic.
Type of company

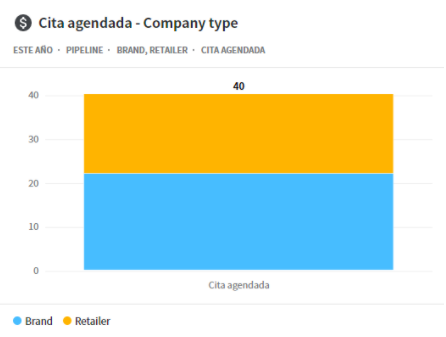
This is the chart that answers the question of: Do I have a better chance of scheduling a brand or retailer meeting?
To make the graphic we have decided to filter according to the number of deals we have in the stage “Scheduled meeting” and if these deals belong to the brand or retailer sector.
As you can see in the graphic, I am more likely to schedule a brand meeting.
Projection
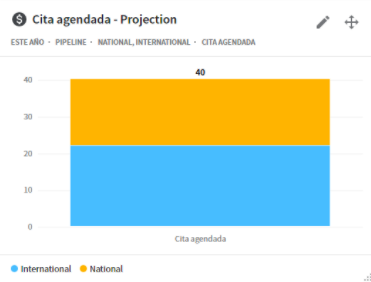
This is the chart that answers to the question of: Do I have a better chance of scheduling a national or international meeting?
To create the graphic we have decided to filter according to the number of deals we have at the “Appointment” stage and whether these deals are national or international.
As you can see in the graphic, I am more likely to schedule an international meeting.

Lost/ Won
The reasons for losing are as follows:
- They are not interested in
- Others
- Service covered
- It is not decided here, it is decided at the head office
- He/She is not in charge
- Internally resolved
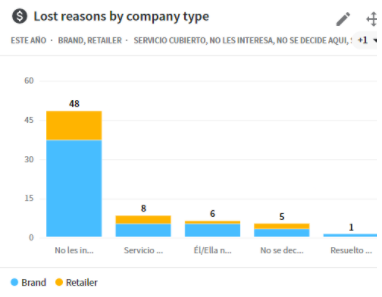
This is the chart that answers the question: Why do I lose brand/retailer operations?
To make the graphic we have decided to filter according to the number of lost deals we have at each stage, if they are brand or retailer and according to the reason for loss.
As you can see in the graphic, the main reason for loss is “Not interested”. We mark this reason when the deal does not show any interest for our client’s product, normally when they give this type of answers it is because they have not read the mail or they do not know very well what it is and what it can bring to them.

This is the chart that answers the question: Why do I lose internacional/national operations?
To make this graphic we have decided to filter according to the number of lost deals we have at each stage, if they are national or international and according to the reason for loss.
As you can see in the graphic, the main reason for loss is “Not interested” followed by the covered service.
The dashboard provides us a list of lost deals with the reasons “Not interested”, from this we can better analyse the emails and, for example, send to them another proposal that is more appropriate to their product or service. We will talk more about the further actions derived from depth knowledge of these reasons in other articles dedicated to Predictable Prospecting.
Origin

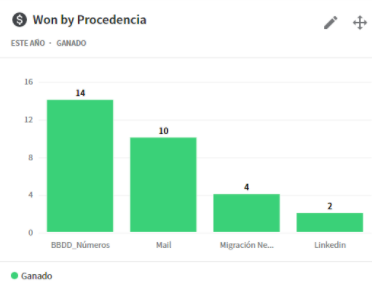
This is the chart that answers the question: Where do the deals that work best for me come from?
To make the graphic we have decided to filter according to the number of won deals we have and their origin.
There are 2 types of origin:
- By the nature of data (Migration* of contacts of other clients or own databases)
- By the channel through which we are impacting (LinkedIn and mail)
Knowing how to identify the channel is more important than we think, we must know which one works best for us in order to invest more time and money in it. For example, as you can see in the graphic above the channel which works best for us is mail, as we have won more deals through this channel. The origin of LikedIn is the one that works less, so we must invest more time and resources in mail and consider using LikedIn as an additional channel, trying to automate most of the management of it.
As you can see in the graphic, the main reason for gaining is the origin by “Numbers of databases”, in it appears the telephone numbers linked to the accounts of the persons included in that database and another type of data as name, emails address, company. These are the prospects who have run the campaign and have received the whole sequence of mail but have not answered. These are uploaded to the CRM and we follow up on them there. These belong to mail, since that is the channel through which they are impacted.
*Migration is the process by which we transfer data from one storage data system to another, from one data format to another or between different computer systems.
Analysis
After carrying out our research, if we look at the graphics above, and with the help of other data such as the volume of companies we have in the databases we can finally say whether or not we are able to achieve our objective.
According to our national database there are 148 brands and 71 retailers and at the international level there are 190 brands and 100 retailers. At first sight, and taking into account only these data, we must bet for our international-brand sector to fulfil our objective, since it is the biggest and we have proved that it is where we thrive most our campaigns.
On the other hand, they are also the ones that they reject us the most as seen in the graphics.
By taking all this data into account, we can create a database that consists mainly in the numbers of national retailers and they seem to lack the service we offer. If we put our best effort into it, we will achieve our goal, 20 leads in 1 month and together with the other sectors we will reach our target.
Conclusion
The external impact
The compared and synthesized graphic data gives us knowledge and allows us to correct the strategy and even the product if we see that the UVP and USP do not fit with the desired market. It is very important to know our target in order to know with precision to which people we should sell our service/product and how to do it to have more impact. Another important factor is knowing how to read the data, since as we have seen in the case above, they provide us with relevant information for our business. But without proper service they do not facilitate profitable and effective decision making.
For example, in the case in the focus, there are several possible avenues for further action:
- Conduct a new market study that interests the client but does not generate many opportunities (retailers at national level) to discover their needs and adapt the product.
- Deepen the surveys of prospects not interested in the product to know better their reasons and change consecutively USP/UVP;
- According to the indicators achieved, recalculated the price of the solution relative to the objective annual sales;
- Expand the vision of niches and markets with greater potential and/or lower customer acquisition costs.
The internal impact
On the other hand, if we know how to squeeze the numbers and get to the bottom of it, we can not only correctly target the product or the marketing strategies but we can also analyse and improve the business itself. There are more or less efficient teams and/or tools. Only by seeing the performance in perspective we can make informed decisions about development, growth and investments, whether in the form of time or money.
For example, we saw above that with good databases and qualified SDRs we deliver more leads than by talking to prospects through LinkedIn. Great, we need to strengthen the SDR and Lead Prospecting team with human capital and automate LinkedIn management with tools so that we don’t focus on something secondary that isn’t even profitable.
Also depending on the causes of lost opportunities, it is possible that some minor corrections in BANT speech can decrease the escape of prospects in the interaction stage.
By consecutively analysing the metrics and indicators established for other positions involved we can improve the process. The final objective may be to find a point where the acquisition cost or maturity speed of a lead is as low as possible.


