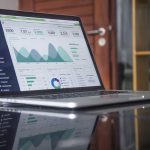
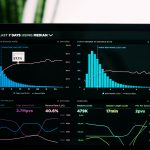
Like any other view in your product, the dashboard has a specific purpose that it’s undertaken to serve. There are multiple popular ways to categorize dashboards based on their purpose, but the main groups are the following:
Operational dashboard
Operational dashboards aim to impart critical information as quickly and clearly as possible. The main goals of the operational dashboard are to present data deviations, show current resources and display their status. It’s some kind of a digital control room designed to efficiently solve time-sensitive tasks.
Analytical dashboard
On the contrast to Operational dashboards, Analytical ones are used for trends and data analysis and decision making. They are less time-sensitive and provide the user with at-a-glance information useless for immediate action.
So the kind of dashboard you create will fully depend on your goals and what you’d like to achieve with it.
You may now proceed to KPIs defining
A Key Performance Indicator is a measurable value that demonstrates how effectively a company is achieving key business objectives. Organizations use KPIs at multiple levels to evaluate their success at reaching targets. High-level KPIs may focus on the overall performance of the business, while low-level KPIs may focus on processes in departments such as sales, marketing, HR, support and others.
What is the difference between a KPI and a metric? Well, with the last one you can measure basically anything if we may say so, whereas the “key” indicator y only used for the conversion rate or something alike. This is because the KPI is also ‘actionable’ – it drives practical steps to improve ‘conversion’ performance.
So, let’s see the difference between Goals, KPIs and Metrics on an example. First establish what the objective is for the KPI. What’s the best measure (numeric, percentage). When this will be tracked (also known as the frequency). Where the data will come from and what the target or goal will be.
- Objective: Increase social Media Leads
- Measure: Number of Leads generated and tracked from all social media sources
- Frequency: Monthly (Daily, Weekly, Monthly, Quarterly or Annually)
- Data Points: How and where will this come from (data sources, manual entry)
- Target or Goal: Goal 50% increase in 12 months
Points to consider while defining your company’s KPIs:
- Make it a team effort. Involving employees ensures that the metrics are relatable and realistic. Moreover, employees are engaged and get a clear understanding of goals and how their work relates to company strategy, which creates a greater sense of commitment.
- Use SMART criteria. They are designed to provide structure and guidance throughout a project, and better identify what you want to accomplish. Briefly, each measure must be: Specific to the purpose of the business, Measurable, Achievable, Relevant to the success of the organization, and Time phased.
- Choose three priority goals and have no more than three KPIs per goal. Focus on linking KPIs or measures to the goals that are most direct and supply the most evidence.
- Resist the urge to add more metrics. KPIs should be effective. While there may be temptation to add more KPIs, metrics must be critical to the operation or tightly linked to objectives improvement, no less, no more.
- Review on a regular basis. The business environment and other factors change over time, so it is important to be nimble. KPIs may need to be adjusted, but when they are, keep them relevant, and keep the overall number of KPIs lean.
- Use reviews as an opportunity to share successes. Taking a look with team members on a regular basis is an opportunity to acknowledge great work, keep motivation high. For the areas that need attention the team can work together on some ideas on how to get back on track.
Here are some worthy examples
Sales Dashboard
Sales leaders need to monitor sales executives and revenue data to hit targets. In the fast paced world of sales, performance is closely tracked. An effective sales dashboard provides ‘at a glance’ sales information to efficiently manage a sales team.
Marketing Dashboard
One of the largest areas of growth in dashboard adoption has been in marketing. The sheer volume of data increasingly generated from digital channels lends itself to being visualized via dashboards. Due to this rapid expansion, marketing dashboards now cover many sub categories such as SEO (Search Engine Optimization), Web Analytics, Content Marketing, Social Media and funnel/pipeline dashboards.
Manufacturing Dashboard
Efficiency drives manufacturing. Keeping processes and equipment performing at their optimum can make the difference between success and failure. Typically manufacturing dashboards are used for both monitoring real time performance and analysing trends to pinpoint opportunities to improve processes.
A KPI Dashboard should display all your KPIs and Metrics for a specific objective in a concise and visually appealing way. But it’s easy to get carried away when designing dashboards. With so much data available from an ever-expanding array of sources – how do you avoid counterproductive dashboards and overloading your audience with information?
We’ll cover this in the 3rd part of our posts cycle.


